Design Statement
Ocean pollution is one of the biggest issues for the environment nowadays. In the past couple of years, with more people worldwide getting more concern about our living environment. We want to provide more detail information for the audiences to know more about how we harming the marine species and ourselves at the same time with polluted the ocean. We started the graphs with plastic pollution, oil spills and sewage which affects the ocean most recently.
Storytelling
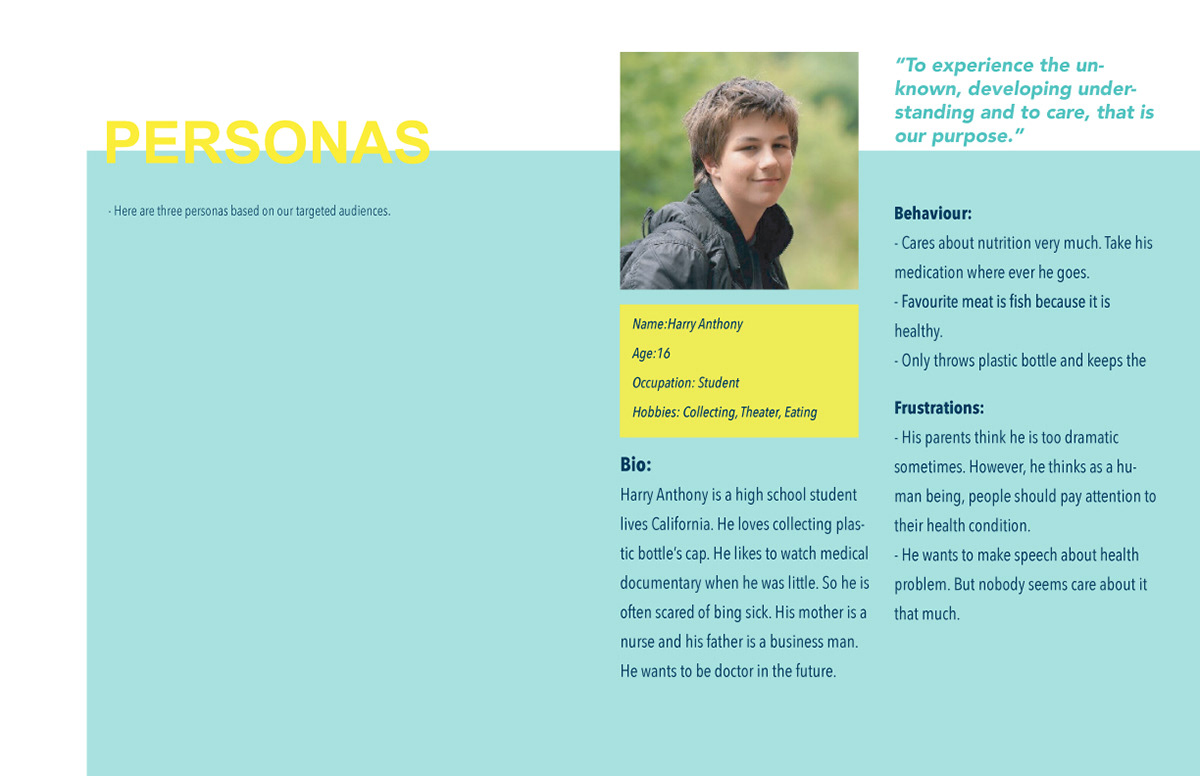
- New generations born after 2000
- People who live in the coastal area
- Companies who are part in the plastic industry
Mainly focus on people who concern body health and new generations who born after 2000. As a trend, youth is getting more care about health comparing compare with the old days.
Also, people who live in a coastal areas that have more opportunities
to have seafood as a meal are our target audience too. We want to show the audiences how pollution will destroy their bodies while they eat polluted seafood.
Also, people who live in a coastal areas that have more opportunities
to have seafood as a meal are our target audience too. We want to show the audiences how pollution will destroy their bodies while they eat polluted seafood.
Target Audience
To grab the audience’s attraction is to start with the audience’s angle, we tell them directly the potential effects of marine pollution and thereby, audiences will associate themselves with the outcomes.
First of all, when audiences look at the graph, their attention will be drawn to the central part of our map. Then from right to left are sections of texts and graphs about how marine pollution was caused, what are the effects on marine life and how does it affect human life. Combining with the information with the central human body graph, audiences will know the severity of marine pollution. Finally, the audience will wonder how can we prevent such outcomes from happening. We provided our audience with several solutions at the bottom of the map.
In the beginning, we thought the best way of informing our audience this issue is by linking the negative effects directly to their daily life. Around that idea, we gradually built up our story based on cause and effect.


